
While the content and general configuration of the dashboard are pre-configured, there are a range of options and controls available within the dashboard itself. This section covers the controls for the dashboard, as well as the controls available for each individual tile and data view within the dashboard.
At the top of the dashboard is a drop-down toolbar panel.
Click anywhere on the header to open the panel. This contains various options divided into groups.
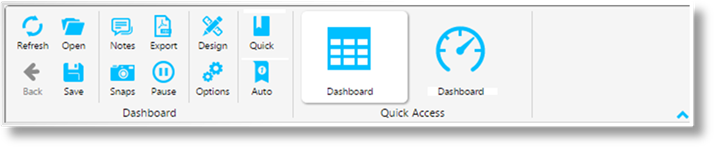
The Dashboard group includes the following options for the currently selected dashboard.
|
|
Refresh |
Reloads all data in the current dashboard. |
|
|
Back |
When using links or controls that navigate between dashboards, the Back button will step back to the previous dashboard. |
|
|
Open |
Opens the Dashboards panel to load a saved dashboard. |
|
|
Save |
Saves all user preferences and settings for the current dashboard. |
|
|
Notes |
Opens the Notes panel to add notes related to the current dashboard. |
|
|
Snaps |
This feature is currently inactive. |
|
|
Export |
Opens the Export Options panel to save the current dashboard as a PDF file. |
|
|
Pause |
When the dashboard is set to automatically refresh, the Pause button stops the refresh until unpaused. |
|
|
Design |
Shifts to the Designers toolbar with the current dashboard open for modification. |
|
|
Options |
Opens the Dashboard Configuration panel to change the settings for the current dashboard. |
|
|
Quick |
Adds or removes the current dashboard from the Quick Access group. If there are no dashboards in the Quick Access group, the group is hidden. |
|
|
Auto |
Makes the current dashboard the default when opening the current instance of SmartView. Only one dashboard at a time can be set to Auto. If SmartView is accessed from different locations (instances), each instance can have its own Auto settings. |
The Quick Access group lists the available dashboards that have been marked for quick access. This is used to quickly switch from one dashboard to another.
The Dashboards panel opens to the right of the screen when selecting Open from the Dashboard group. Click X to close the panel again.
The dashboards are displayed by
category. Each category can be expanded or collapsed using the  and
and  icons.
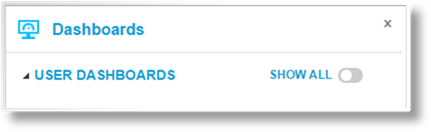
The User Dashboards category includes all dashboards that you have marked for Quick Access, currently or in the past.
Click Show All to display all available dashboards. This includes dashboards that you have created, dashboards that have been marked as available to everyone, and dashboards that you can access due to a security role.
Click the name of a dashboard to open it.
The Dashboard Configuration panel opens to the right of the screen when selecting Options from the Dashboard group, and contains settings for the currently selected dashboard. Click X to close the panel again.
The options are displayed by
category. Each category can be expanded or collapsed using the and icons.
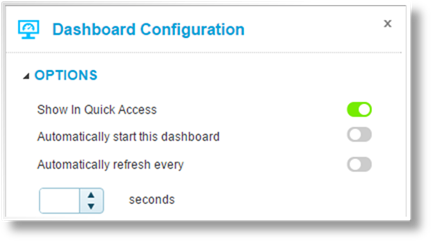
The Options category includes the following options.
|
Show In Quick Access |
When activated, this option causes the current dashboard to be included in the Quick Access group. |
|
Automatically start this dashboard |
When activated, this dashboard will be loaded automatically when opening SmartView. Only one dashboard at a time can be set to start automatically. If SmartView is accessed from different locations (instances), each instance can have its own settings. |
|
Automatically refresh every |
When activated, the dashboard will refresh all data at intervals entered in the Seconds field. |


