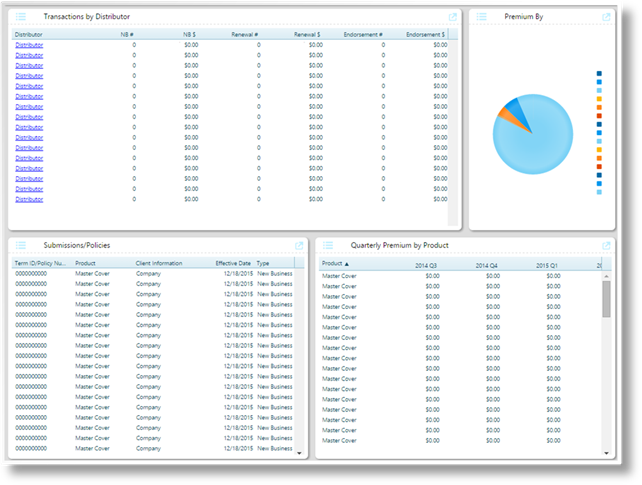
SmartView is a data tracking and management system, providing customizable and interactive data views arranged in "Dashboard" screens. Data from throughout the system can be collected and displayed in a range of tables, graphs, and charts, with interactive connections that allow one data view to adjust, filter, or even replace another data view.
For details on configuring and managing SmartView, see the User Guide – SmartView document.
The default SmartView dashboard for policy information tracks policies and transactions, with views related to distributors and premium.
The dashboard is accessed using the SmartView option under the Reports menu, and can also be displayed in the Home page.
See the individual view descriptions below.
The Transactions by Distributor view lists all distributor companies that are associated to at least one transaction.
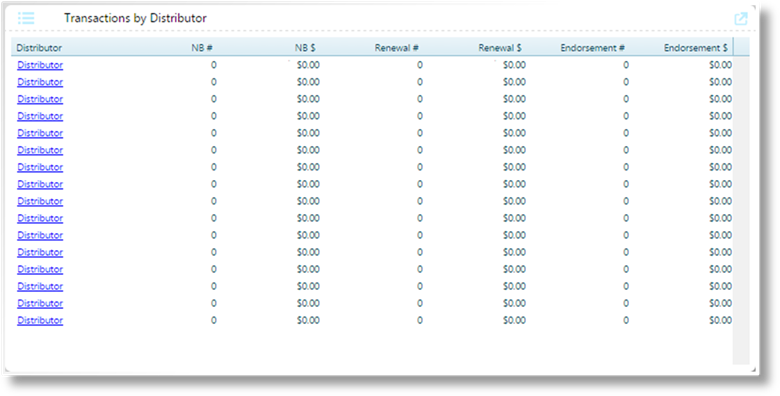
For each distributor, the NB (New Business), Renewal, and Endorsement transactions are summed up by number of transactions and total premium dollar value.
Selecting a distributor automatically filters the content of the Submissions/Policies view.
The Submissions/Policies view lists all transactions. If a distributor has been selected in the Transactions by Distributor view, this view will be automatically filtered to display the transactions associated to that distributor.
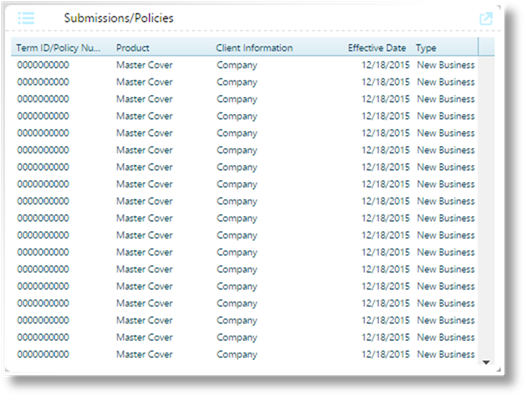
For each transaction, the view displays the following details:
|
Term ID/Policy Number |
The assigned policy number, or the ID number if no policy number has been assigned. |
|
Product |
The name of the product (master cover) for the transaction. |
|
Client Information |
The name of the client company or individual client associated to the transaction. |
|
Effective Date |
The effective date of the transaction. |
|
Type |
The transaction type. |
|
Status |
The current status of the transaction. |
|
Premium |
The calculated premium for the transaction, not including taxes. |
|
Taxes |
The calculated taxes for the transaction. |
|
Currency |
The currency of the calculated premium and taxes. |
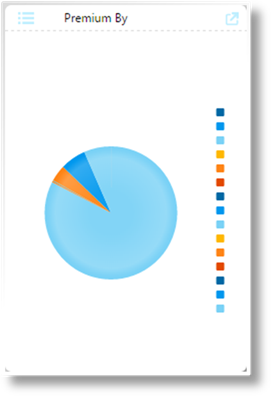
The Premium By view provides a pie-chart view of the total premium broken down by distributor.
The Quarterly Premium by Product view lists all products (master covers) that have associated transactions, with the total premium summed up for each quarter.
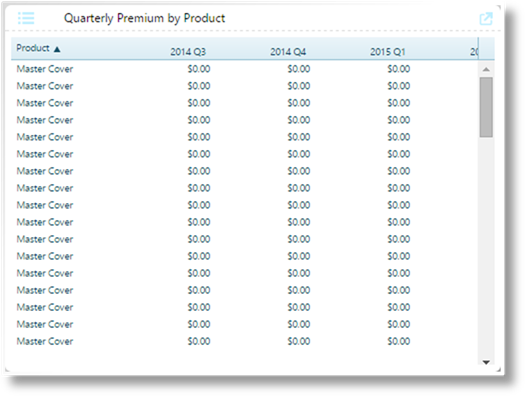
For each product, the view displays the calculated premium for each quarter.