
The Monthly Bound Premium Summary report comes in two versions, based on the transaction Bound Date or the transaction Effective Date. Both reports provide graphs, charts, and tables about bound policies.
When the report is selected from the reports grid, it opens with the default settings.
|
Bound / Effective Date From/To |
Enter the
dates, or select them from the calendar lookup |
|
Period |
The graphs and tables are divided into periods. Select Monthly, Quarterly, or Annually. |
Click Run Report to refresh the report with the new settings.
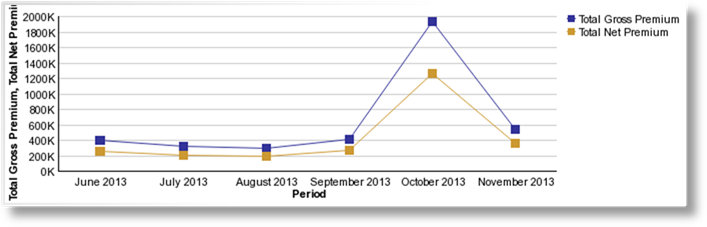
The Total Gross Premium, Total Net Premium graph displays the total premiums for each period.
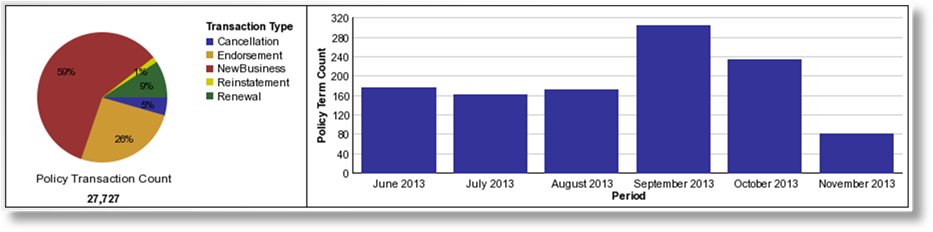
The Policy Transaction Count chart shows the total transaction count, broken down by transaction type.
The Policy Term Count graph displays the number of terms per period.
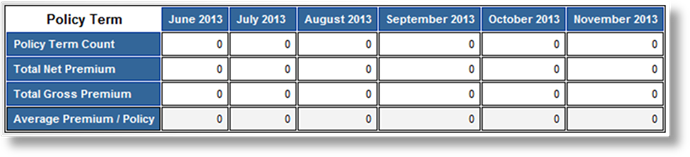
The Policy Term table lists the term count, the premium, and the average premium generated by policy.
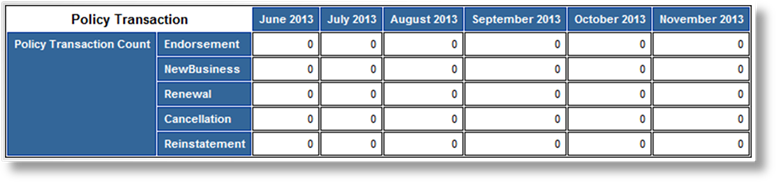
The Policy Transaction table lists the number of each transaction type per period.
 , to restrict the results to
transactions that are bound or take effect during the selected range,
depending on the type of report.
, to restrict the results to
transactions that are bound or take effect during the selected range,
depending on the type of report.